Today's distributors and manufacturers have masses of data in their ERP, CRM, accounting, or other back-office systems that are often not utilized to their fullest.
In a highly competitive market, many are seeking to unlock the hidden revenue-generating potential of that data to help retain and grow sales. So much so that The Gartner Future of Sales 2025 report reveals that 60% of B2B sales organizations will transition from intuition-based selling to data-driven selling by 2025.
In this post, we briefly look at the different types of data that exist in your business systems and how mixing them together can provide immense insights that lead to more revenue opportunities and efficiencies.
There are primarily two different types of data that can influence your sales: hard and soft data. Sales data can tell you a lot about your sales teams' performance and can give you insights into your next steps, where to focus your time and prevent missed sales opportunities.
Data is key when it comes to your sales analytics and enabling your salespeople, and when used correctly, it can massively impact your sales and your overall revenue.
What is hard sales data?
Hard data is quantitative data and covers anything that is factually objective, such as customer transactions detailing what products were purchased, in what volume, and when. It can be expressed as ‘Customer A brought X amount this month’ - an indisputable fact.
%EF%B9%96width=756&name=Machine%20learning%20example%201_%20(2).png)
What is soft sales data?
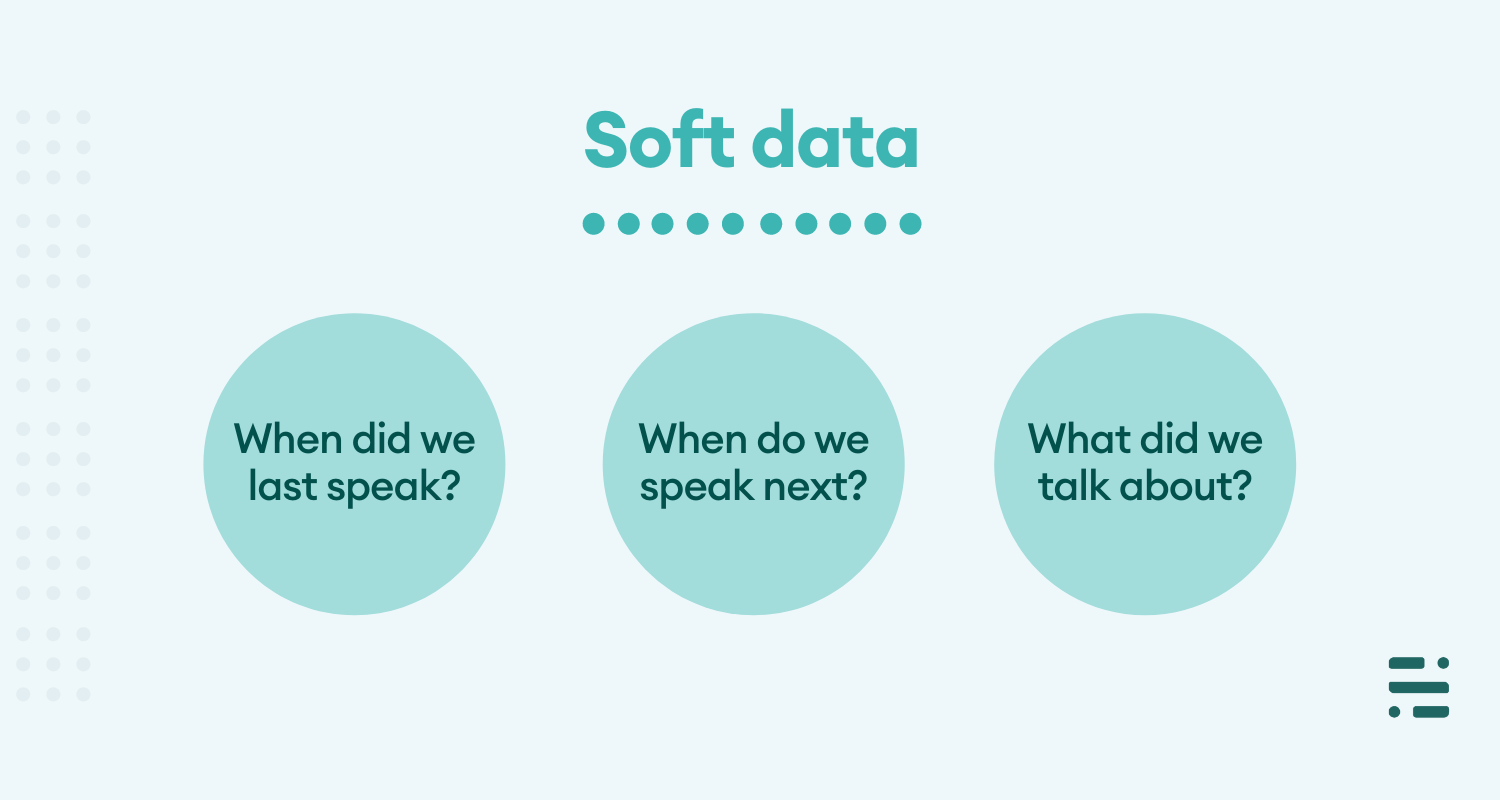
Soft data is qualitative information that is possible to change or relies on the salesperson's impressions or plans, like 'What did we talk about last time we met?', 'Who is their current supplier?', or 'When are we due to meet next?'. Soft data is just as important as hard data when it comes to sales analytics.
What are the benefits of mixing hard and soft data?
Mixing hard and soft data allows modern product sales teams to get valuable insights into their hands and be not only reactive but also proactive in retaining and growing revenue.
How can you get outcomes from your hard and soft data?
There are many different ways that you can get outcomes from your hard and soft data and ways that you can combine them together to give you quick and actionable insights.
1. Use generic analytics software
One of your options when it comes to sales analytics software is to use a generic BI or analytics software. Whilst you’ll be able to analyze data from your back-office system, you will have to rely on manual processes to get the right insights into the hands of your sellers, which takes time and effort.
It puts the ones (and time and effort) the salesperson to identify the right insights from their analytics data and then act on it, which is hard to justify when we need to ensure every sales resource is as productive as possible when it comes to generating revenue opportunities.
2. Build a system yourself
You could always try to build a system yourself with your IT team. The problem with this is that it can take a long time (from months to potentially years), and it can also be a very expensive route.
3. Use a system that already exists
Another option is to make use of a tried and tested tool like sales-i. One of the advantages of this option is that you’ll be able to immediately benefit from a product that is specifically designed for product manufacturing and distribution teams.
You’ll be up and running in around 30 days and have access to plenty of training opportunities so that your team will be able to instantly reap the benefits.
Having previously worked with thousands of customers in the distribution and manufacturing sectors, you’ll also be able to take advantage of our unique field expertise.
%EF%B9%96width=758&name=Copy%20of%20Enquiries%20(7).png)
How sales-i mix your hard and soft data
sales-i works by connecting to your existing back office or ERP system and bringing all of your hard data into one place in a format that is simple to understand and easy to access, with minimal input. It also makes it effortless for salespeople to record their activities associated with each customer.
Everyone from the sales rep to the CEO has safe access to the sales data insights it provides via desktop or the mobile app, without fear of breaking any report or dashboard.
From viewing customer details and seeing what you last spoke about to diving into your sales data and generating easy-to-understand reports at the click of a button, sales-i mixes your hard and soft data so you can sell smarter.
Within sales-i, hard data is transactional data that they can’t affect; soft data is mouldable and can be changed or updated as required by the salesperson.
Traditional reporting tools like those in your ERP system or accounting system can only look at transactional data, preventing you from cross-referencing this with soft data that’s been captured by your sales team.
By making use of the soft data in the CRM side of the sales-i platform, you can incorporate information such as the size of the business, who’s their main supplier or the last time you called the customer and correlate that with hard data such as who hasn’t brought in the last 2 months.
For example, by bringing these two together, you can then view a list of all of the customers who:
- Have a competitor as their main supplier
- You haven’t called in the last 30 days
- Haven’t purchased from you in the last 2 months
This generates a list of all of your customers that these criteria apply, so you know who might be starting to slip through the net!
You can take this one step further by pinpointing all of these customer locations on a map and looking at their geographical locations to further narrow down what might be causing this.%EF%B9%96width=758&name=Copy%20of%20Enquiries%20(6).png)


